My Role
Lead Product Designer
FRAMES is the system of record for Amazon's Chart of Accounts — the coding structure behind all financial reporting. I designed the disable-segment experience, making the downstream consequences of retiring a segment code visible before the change is committed.

Amazon's financial reporting runs on account codes. The reporting structures built on them are what roll everyday transactions up into the statements executives review and auditors examine. Disable one code, and any structure that references it can break.
The request flow showed users none of those connections. That blind spot had a documented cost: mismatched mappings led to formal Corrections of Error, in which millions of dollars in cost were charged to the wrong services and a site was recorded under the wrong country. Teams in four organizations then spent days every month manually repairing reporting errors that had started upstream, in metadata nobody could see.
Timing made it worse. Changes ship monthly against a mid-month cutoff — as one supply chain manager put it, "it's always a scramble to get a request in before the cutoff. Miss it, and you wait a whole month." People had the least time exactly when they were most likely to skip checking.
The question: nobody sets out to misallocate cost or mislabel a site. So how do we reduce errors that come from changes people genuinely believed were safe to make?
Errors were reaching audited reporting, and every previous attempt to fix it had asked people to be more careful. I worked backwards to find out why that wasn't working.
Stopping at any earlier why produces the wrong fix. Why 2 leads to training people who have no information. Why 3 leads to a lookup tool nobody opens before submitting. Only at Why 5 does this stop being a discipline problem and become a missing feedback loop — which is something design can actually close.
The fix wasn't new logic — it was timing. Every dependency a requester needed was already being computed, just after submission, when nobody could act on what it found. The design problem was moving that same knowledge in front of the decision and letting the impact itself drive the choice.
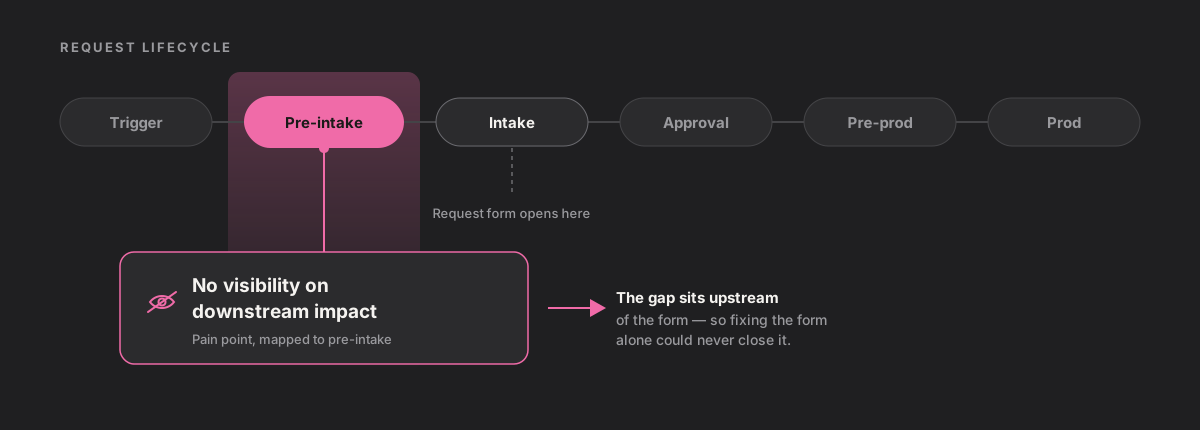
To find where the blind spot actually lived, I mapped the full request lifecycle across six phases and layered personas, tools, pain points, and opportunities onto each. Two pain points clustered in the same early phase — before the request form ever opened.
"No visibility on downstream impact" mapped to pre-intake, one phase before the request form even opens. Its position mattered as much as its existence: improving the form alone could never have closed it.
"Different personas need different data for choice-making." Four roles act on impact data, and each stops at a different depth — the diagram below maps which. Nobody consumes the whole page, which is why one flat view could never serve all of them, and why the solution became layered.
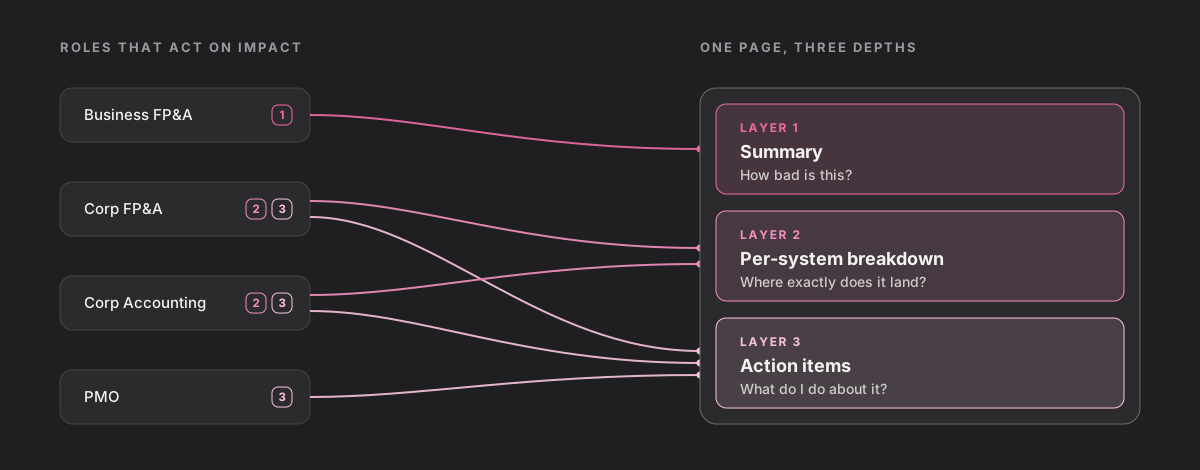
The opportunity carried forward came directly from the map: show a downstream impact preview for different choices — layered, so that someone deciding in a hurry and someone auditing their own area could both read one page.
One screen, shown before the change is committed, that answers three questions in order: how bad is this, where exactly does it land, and what do I do about it. Each layer of the page closes one of the gaps the five whys exposed.
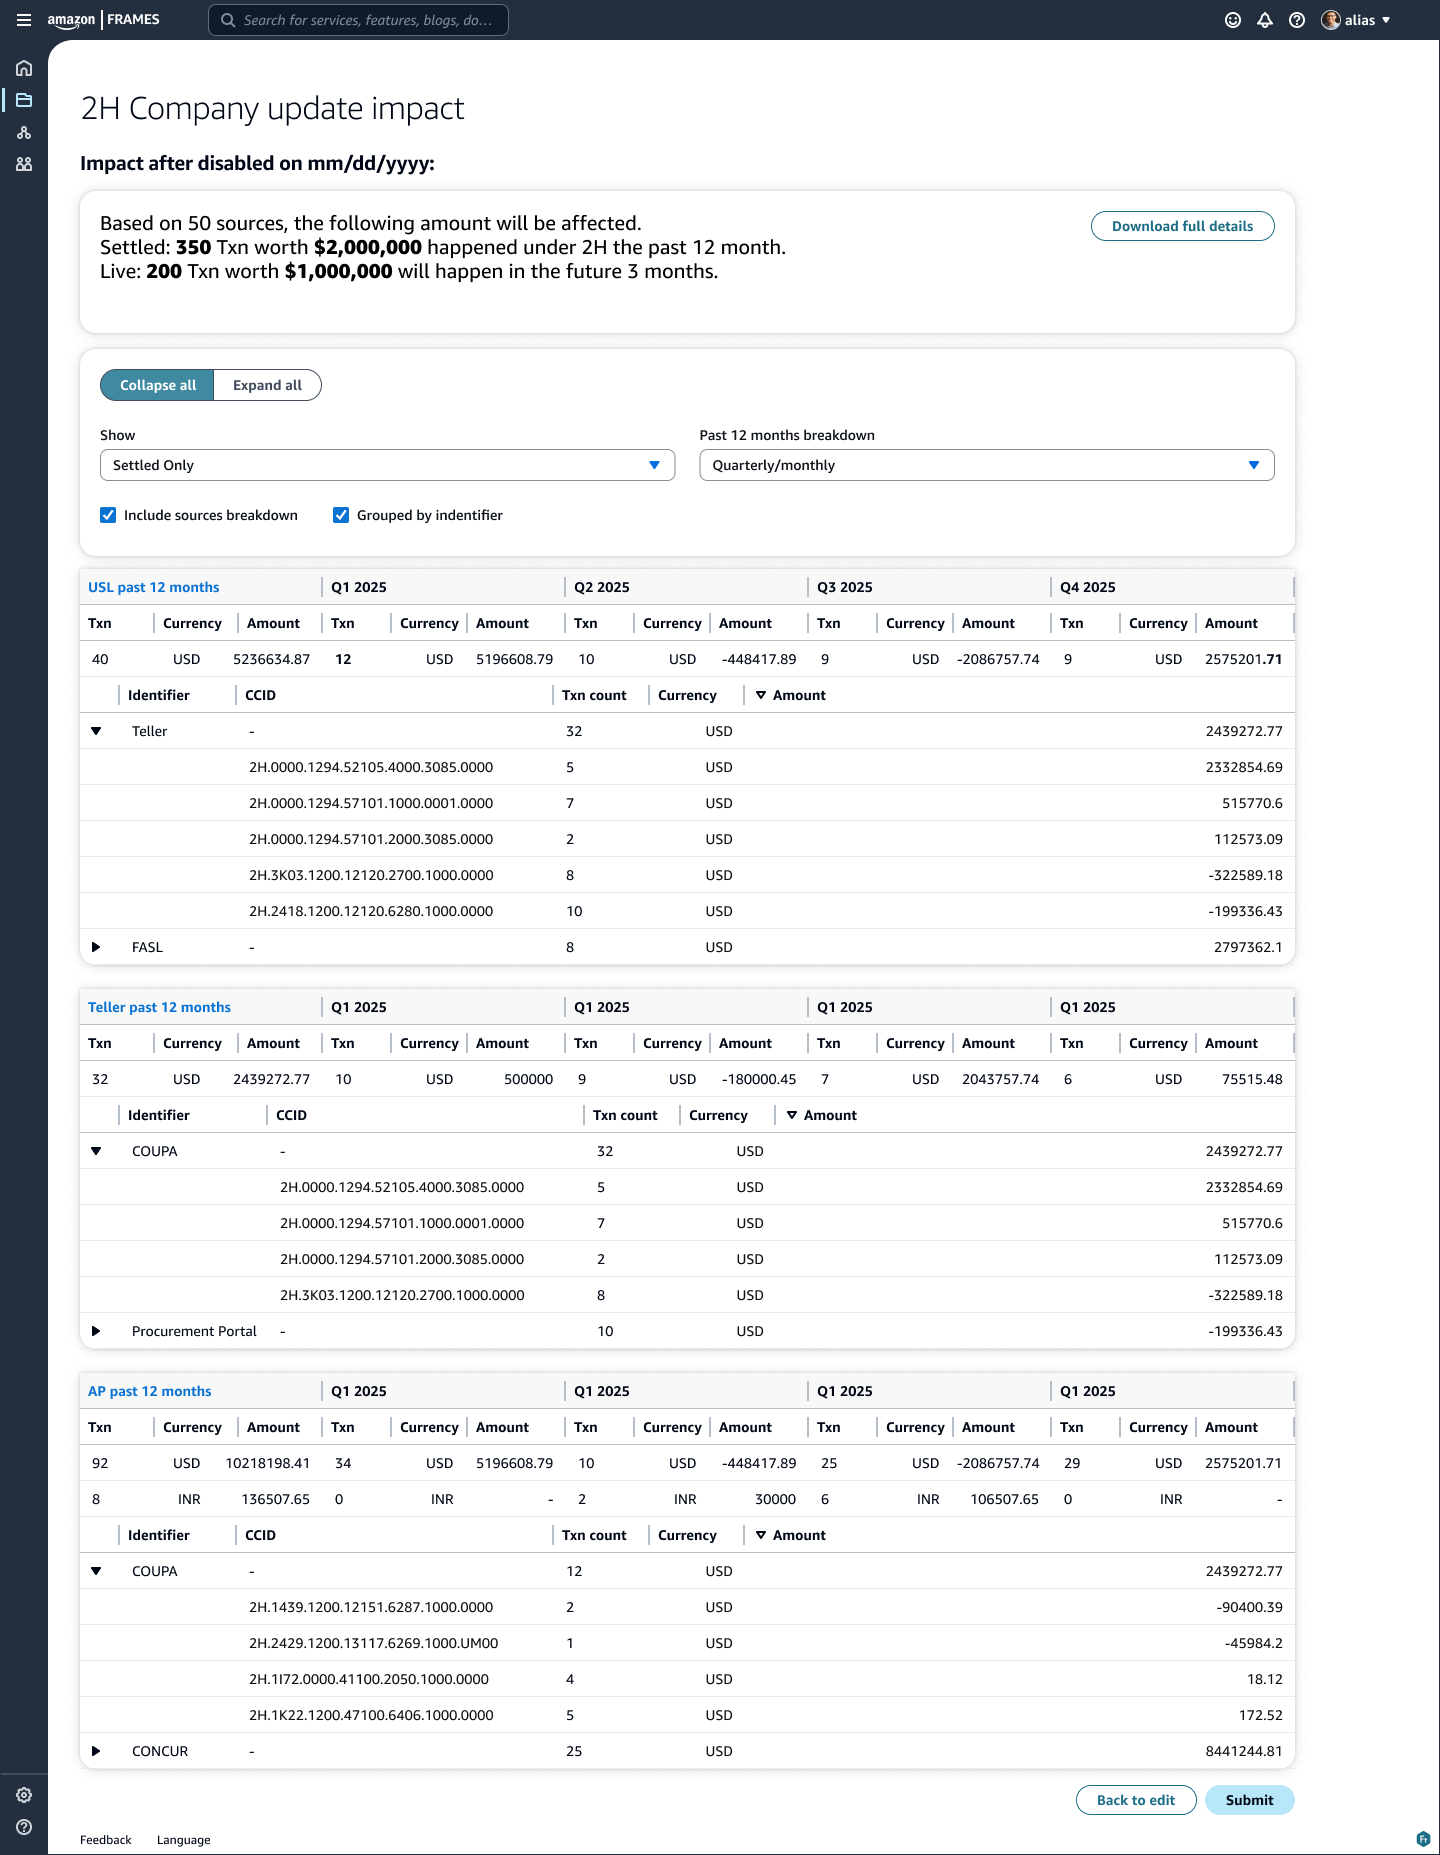
Total downstream impact and live transactions affected, stated before any detail.
Closes Why 3: the data existed, just scattered across three systems. Aggregated into one headline, "is this safe?" no longer requires knowing where to look.
Impact split across each downstream system, with filters to narrow to the area you own.
Closes Why 2: other teams' dependencies become named, distinct consequences instead of one vague warning. Filters matter because segment ownership is split and sometimes shared — each owner needs their slice, not everyone's.
Every impacted area links to its ticket and its full system-level detail.
Closes Why 5, the root cause: consequences used to surface weeks later, to someone else, with no path back. Linking impact to tickets means the person making the change sees the consequence and owns the fix. Awareness alone would leave them informed but stuck.
Three constraints in the underlying data shaped this page more than the layout did. Each is worth a longer conversation than a case study allows.
The requester sees consequences. The approver has to rule on them — often across dozens of requests in a single cutoff window. This screen is built for that job: decide, with as much or as little evidence as the call requires.
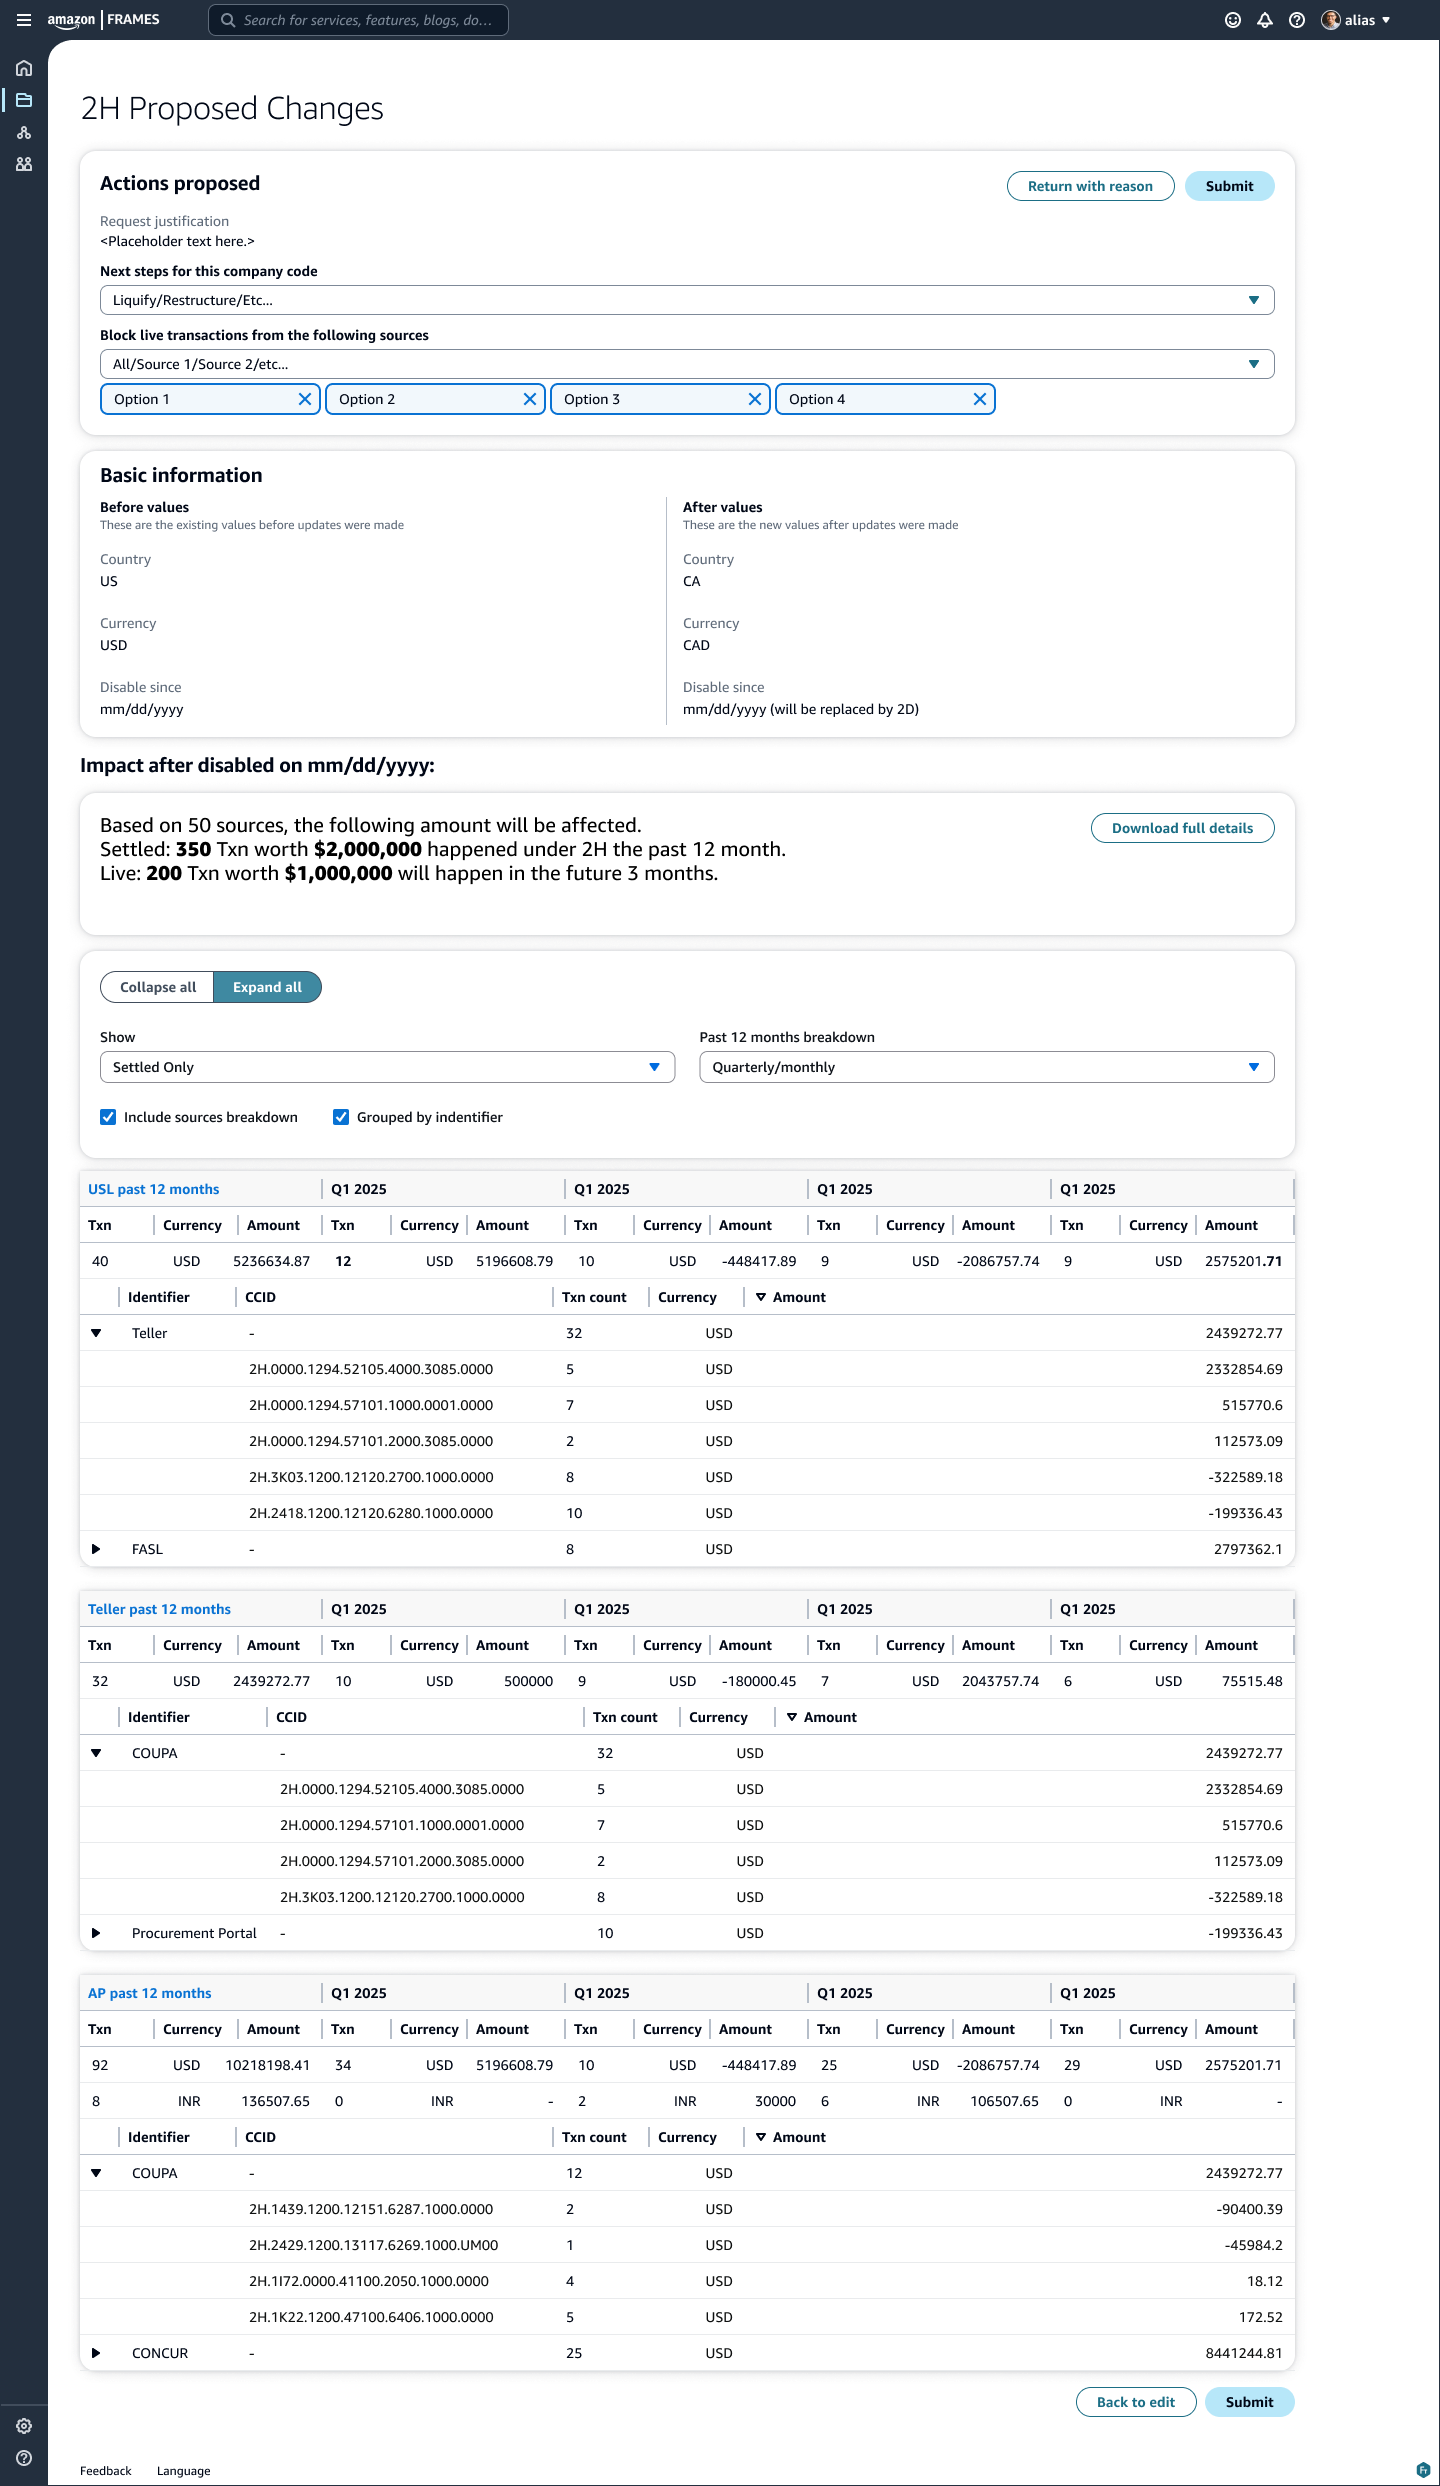
Every action open to the approver sits at the top of the page, above the evidence. They know what they are being asked to do before they read a single number.
Directly under the actions, the request is stated as before and after values in parallel columns. The change itself is legible in one pass — no diffing two screens, no reconstructing what the current state was.
The impact block runs coarse to fine: headline totals, then filters, then per-system rows. An approver who is confident at the summary can rule immediately; one who isn't keeps reading until they are. Same page, either path — the depth is the approver's choice, not the page's.
Note: figures shown are directional and rounded. Detailed internal metrics are confidential.
The most useful thing I did was model the dependency relationships before designing any screens — once the structure was clear, the interface question largely answered itself. The hard part was severity, and I'd push on it earlier. My first prototypes surfaced every dependency equally, which was accurate and overwhelming. Anchoring severity to the org's existing controllership risk framework made the model both defensible and easier to align on; deciding what not to elevate turned out to be the higher-leverage decision.
More broadly, this project changed how I think about systems with slow release cycles. When a fix can't ship quickly, the interface has to carry more of the safety burden — prevention becomes a design responsibility, not only an engineering one.