My Role
Lead Product Designer
ACME is the engine that governs which account code combinations are allowed to exist. I designed the rule authoring and governance experience: replacing a format only specialists could decode, and closing the gap where a rule change never reached the combinations already in use.

Every financial transaction is coded to a combination of seven segments — company, location, cost center, account, and three more. Which combinations are legal is decided by cross-validation rules. Those rules are the guardrail between a clean set of books and a misallocated one.
The guardrail had become unreadable. A rule is written as pairs of full-width coded strings, so understanding one means decoding it position by position — and a single requirement can take eight of those lines to express. Because a rule can be edited indefinitely to admit each new exception, rules drift from their original purpose and start overlapping: one set of cost-center rules ran across five near-identical entries, each restating the same long list. Nowhere in the format is there a field for why the rule exists, who owns it, or when it last changed.
Getting it wrong is expensive to undo, because a code combination can never be deleted — only switched on or off. Before one can be safely switched off, five separate categories of dependency have to be cleared: system configuration, master data, open and future-dated transactions, currency revaluation, and every downstream system that consumes the code. A rule change is not a small edit.
The cost shows up as time. Managing rule tickets and changes takes the close team roughly 350 hours a year, and that figure excludes every other team's time spent working out why a posting failed.
So the question was not how to write rules faster. It was: how do you make a control legible enough that the people accountable for it can actually tell what it does?
Before designing anything, the team ran behaviour tests against the ERP to establish what it actually does with rules and combinations, rather than what everyone assumed. Four findings came back, and they reframed the project:
Put together: a combination that was compliant the day it was created can be squarely against the rules today and still post without complaint. Everyone believed the rules were an active control. They were a one-time gate.
There was a second finding that mattered just as much. Because rules can overlap and even contradict each other, any automation built on top of them would be taking ambiguous instructions. Fixing the propagation gap without first fixing the rule set would just automate the confusion.
The readability problem and the automation problem were the same problem.
These had been treated as two separate workstreams: clean up an awkward format, and separately build synchronisation. Discovery collapsed them into one. Automated synchronisation only produces a correct answer if the rules give it an unambiguous instruction, and rules only stay unambiguous if the people writing them can see what they already say.
That set the order of the work. Make the rule legible first, use that same structure as the input to automation, and only then let the system act on existing combinations.
The design works in two halves: change the artefact people author, then give them sight of the consequences before they commit. Each part answers one of the gaps above.
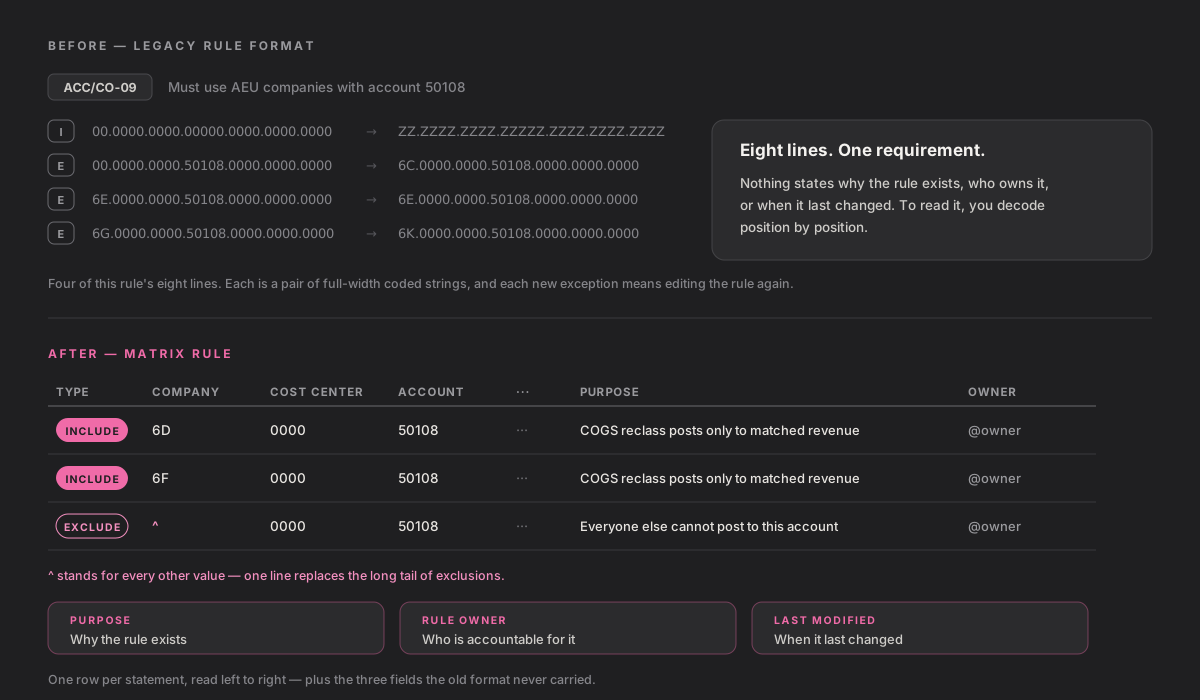
The Matrix Rule replaces coded string pairs with one row per statement, under named segment columns. A single caret stands for every other value, so the long tail of exclusions collapses into one line instead of many.
Closes Why 4: the format now carries purpose, owner, and last-modified date. Accountability becomes a property of the rule rather than something living in someone's memory.
Authoring a rule shows how many existing combinations would change status if it were approved, and which ones. Approvers review that assessment as part of the approval, not after it.
Closes Why 3: a rule change stops being an isolated edit. The consequence for what is already in use is stated up front, in the same screen where the decision is made.
Validation runs before submission and blocks two things outright: a rule that duplicates an active one exactly, and a rule that directly contradicts one covering the same combination. Where overlap is legitimate, documented precedence decides the outcome.
Closes Why 2: this is what makes automation safe to build. The rule set has to be unambiguous before anything is allowed to act on it.
Scheduled jobs compare segment statuses, combination statuses, and rule logic against each other and report anything that has drifted apart.
Closes Why 1: synchronisation is the primary fix; reconciliation is the guardrail behind it, so a gap surfaces on a schedule rather than during a close.
Legibility, then validation, then automation, then reconciliation. Each step is a precondition for the next: an unreadable rule cannot be validated, an unvalidated rule set cannot be automated safely, and automation without reconciliation has no way to prove it worked.
Placeholders below — swap each for a real capture when the build is far enough along.
The design is signed off and in build; there is no launch date yet, so there are no outcome numbers to report. What exists is a measured baseline and the specific things it should move.
Stating the baseline before launch was deliberate. The 350-hour figure is the one number that made this project legible to people outside finance, and it is the number the work will be judged against.
[Add reflection — this section is yours to write. Worth considering: the decision to fix the rule format before building the automation, what the behaviour testing changed about your assumptions, and what you would want to have validated with rule owners earlier.]