My Role
UX point of contactRequirements review, low-fidelity mocks
Risk, controllership, and security teams each tracked risk in their own tool, on their own terms. Risk manager is the single place a risk is written down, scored, answered for, and watched. The hard part was not consolidation — it was designing a scoring model where a component risk and the enterprise risk above it feed each other without either one distorting the other.

Before this project, a risk was scored on experience. A manager read the situation, formed a judgement, and wrote a number down — then filed it in whichever of 6 different tools their team happened to use.
That left 2 problems. The scores were subjective, so when leadership or an external auditor asked what one actually meant, the answer arrived with a learning curve attached — or depended on the manager who set it still being around to interpret it.
And the risk library, though it existed, was close to unusable. Nothing standardised how a risk was categorised, so locating a relevant precedent was slower than writing a fresh entry. So people wrote fresh entries. The library kept growing and stayed useless.
4 roles touch the same risk and want different things from it: a practitioner who finds it and writes it up, an owner who answers for it, an approver who rules on it, and an engineering team that configures the platform the other 3 stand on.
What each role is barred from doing shaped the design more than any feature did:
The first and last are the same rule twice. An approver who could edit would quietly become the author; engineering with a route into a risk record would quietly become an owner.
Set those rules against the lifecycle below and the gaps are as deliberate as the overlaps. Practitioner and owner can both score, so the model never insists on who holds the pen. Neither can touch the risk during approval. The engineering lane is empty end to end, and the status row underneath makes each state somebody's move.
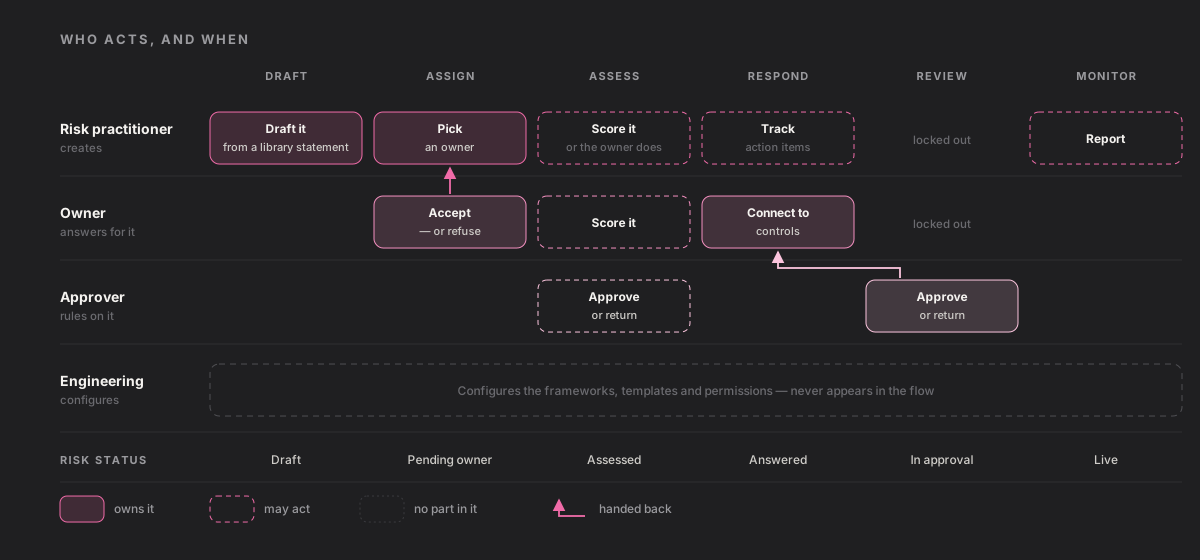
When 3 functions each hold part of the same risk, who gets to decide how serious it is — and how does everyone else find out?
I interviewed 10+ risk managers across the 2 internal teams whose people would live in this tool daily. I expected 1 process with local variations. I found 2 processes that disagreed about something more basic than tooling: how many people it takes to decide that a risk is real.
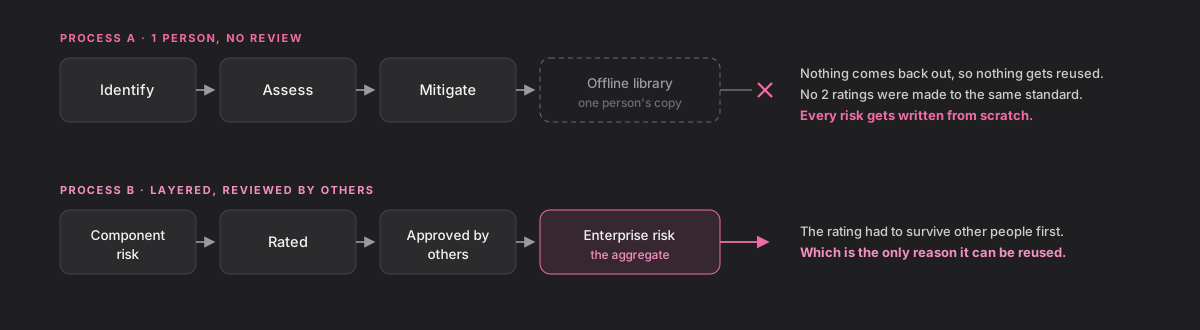
The left-hand process is worth sitting with, because its failure never shows up as a missing feature. Nothing in it is broken. It simply never required anyone to agree with anyone else.
2 managers could score the same exposure differently and both be right. There was nothing to be wrong against.
The layered process became the methodology. That settles the tooling question and opens a harder one: the people who had worked alone must now adopt an unfamiliar process, wait on approvals they never needed, and learn a scoring model in place of their own judgement. Whether that is worth asking of them is the next section.
No verbatim quotes are reproduced here — I have not cleared any for external use. [Add one if you can clear it; this section would carry it well.]
Stopping earlier produces a worse product. Stop at question 1 and risk stays unmeasurable by nature, which is an excuse. Stop at question 2 and you conclude that scores are subjective and always will be, which is the reason nothing had changed for years.
Only at question 4 does the problem become buildable: not make people more consistent, but name the dimensions, and let each organisation set the units. Which is also why review earns its cost — a metric only means the same thing twice if somebody other than its author has agreed to it.
16 today. 20 once the queue clears. Which one are you approving?
The arithmetic is plain: inherent score = likelihood × impact, which says how much damage a risk could do with nothing holding it back.
At the enterprise level that number is unsettled. Components join and leave over time, and some are in an approval queue right now — so the total on the page is only the total as of whatever has been approved so far. An awkward thing to hand an approver and call a decision.
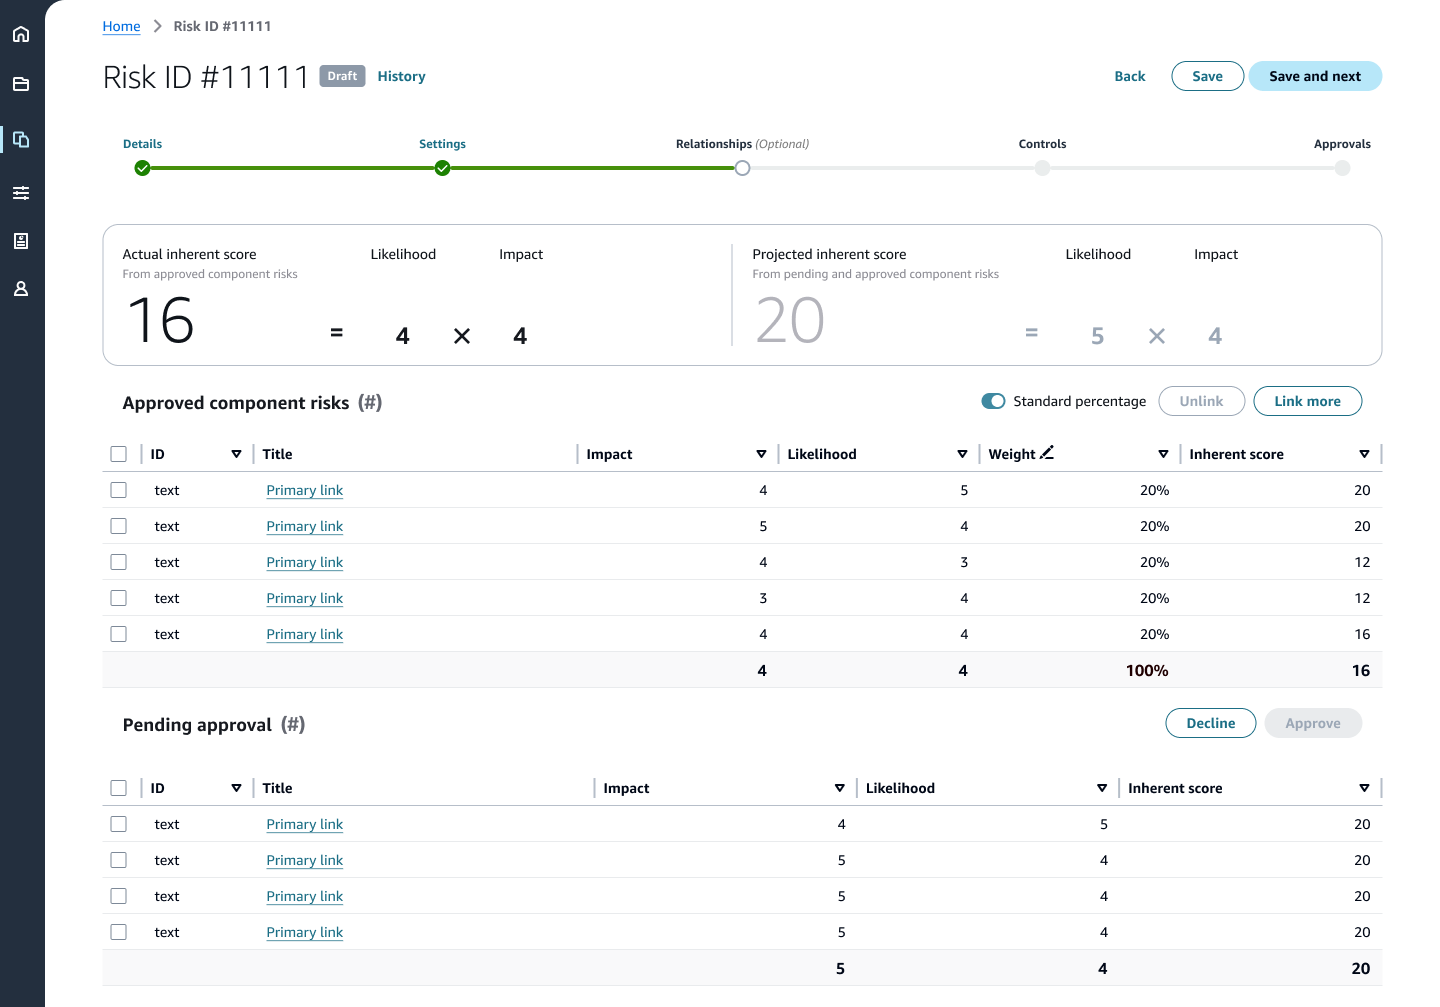
The projected total lets an approver see where their number is heading before they rule on the thing that moves it. 16 today, 20 if the queue clears.
The other lever is weight: each component carries a share of its parent, defaulting to an even split and freely reset. The table then closes on a total row holding the parent's own aggregate impact and likelihood — the 2 figures that actually produce the headline, sitting directly beneath the rows they came from.
Nothing is hidden and nothing is automatic, which is the point. A score can be argued back to the factor that produced it rather than accepted because the system said so.
Merging the tools was the easy half. Done naively, consolidation destroys what the scattered setup had been preserving by accident: a judgement that only makes sense locally, a finding not everyone should read, somebody's right to say no. Each decision below puts one of those back.
A risk passes through 5 places: a library of published frameworks, a register of what one organisation has identified, assessment and response, monitoring, and a control mapping. Keeping the first 2 apart matters most — a framework is reference material, a register entry is a commitment by a named organisation, and merging them is how the old tools became ambiguous.
A risk record is either an enterprise risk or a component of one — never both, never 3 levels deep. Any record you open has exactly 1 question to answer about its position, not a tree to trace.
What travels between the levels runs in opposite directions. Scores move up: components are scored individually, and the enterprise risk holds the aggregate. The threshold moves down: set once on the enterprise risk, inherited by every component.
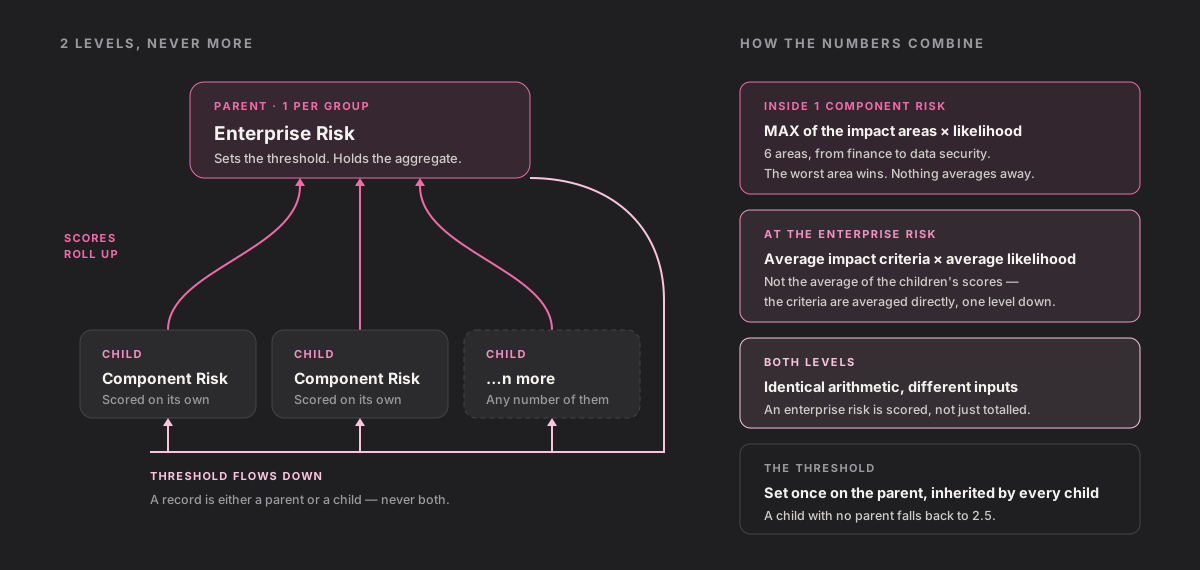
The 2 aggregation rules above are deliberately opposite. Taking the highest impact area inside a component means a risk that is catastrophic in one respect and harmless in 3 stays catastrophic — nothing gets diluted by what it does not threaten.
One level up, that logic would be destructive, so it inverts. The enterprise risk averages the underlying criteria rather than its components' finished scores, because averaging finished scores lets one severe component drag the whole parent upward. Within a risk, protect the worst case. Across risks, protect proportion.
Both rules stay abstract until you watch somebody fill them in. Here are the 2 screens where that happens — one at the start of an assessment, one at the end — built to the same visual rule: inputs left, what they produce right.
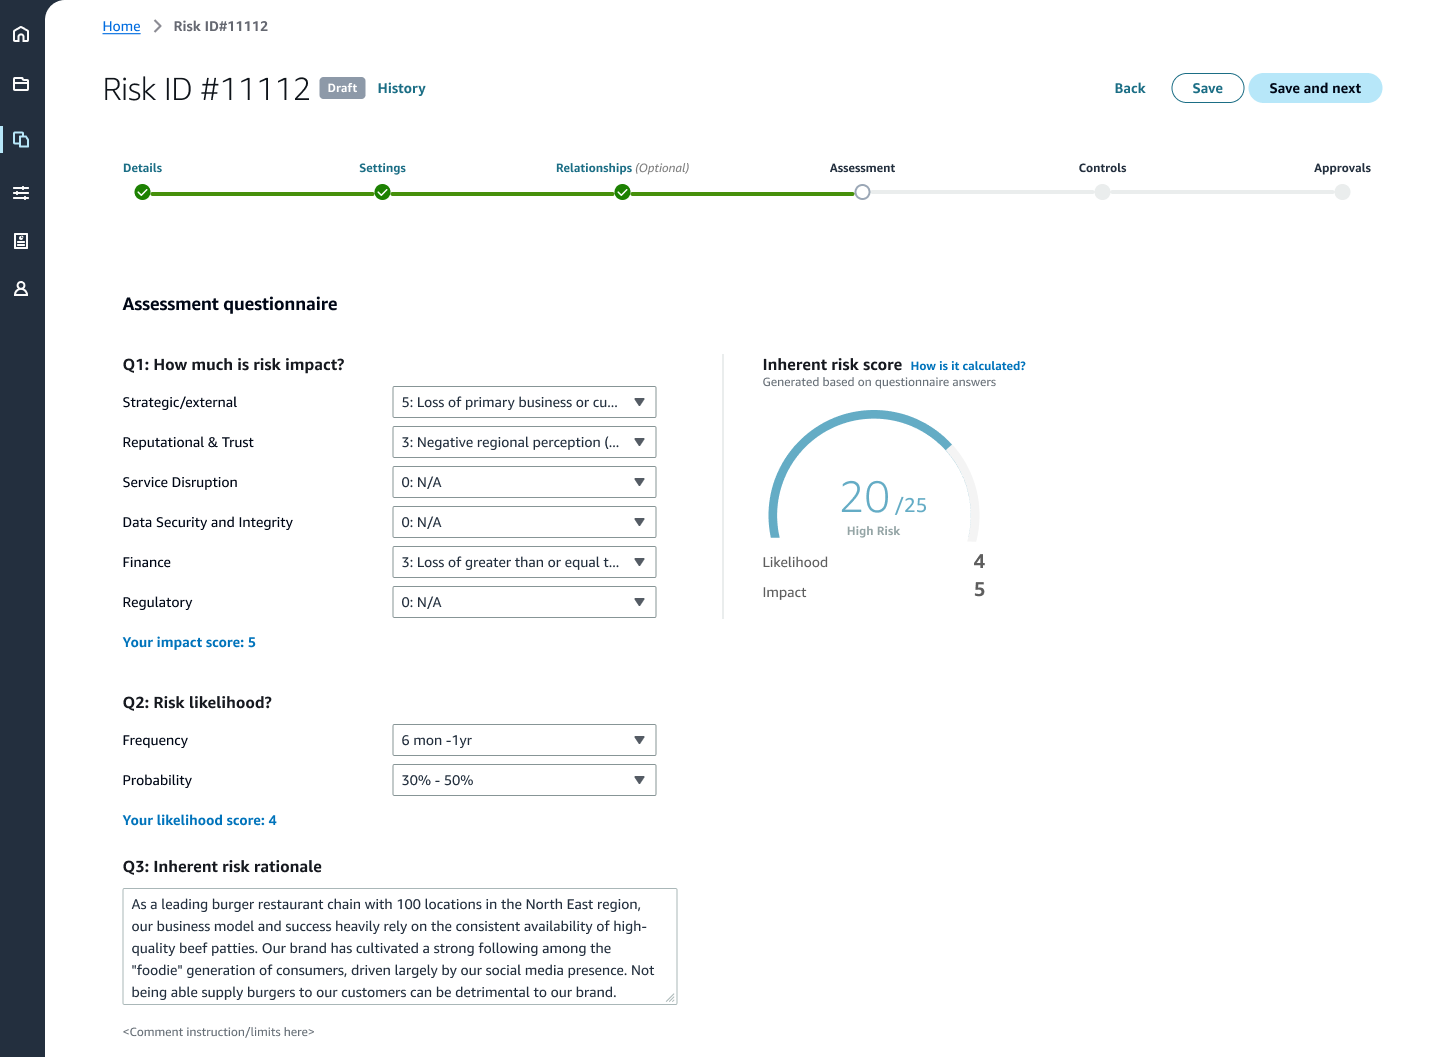
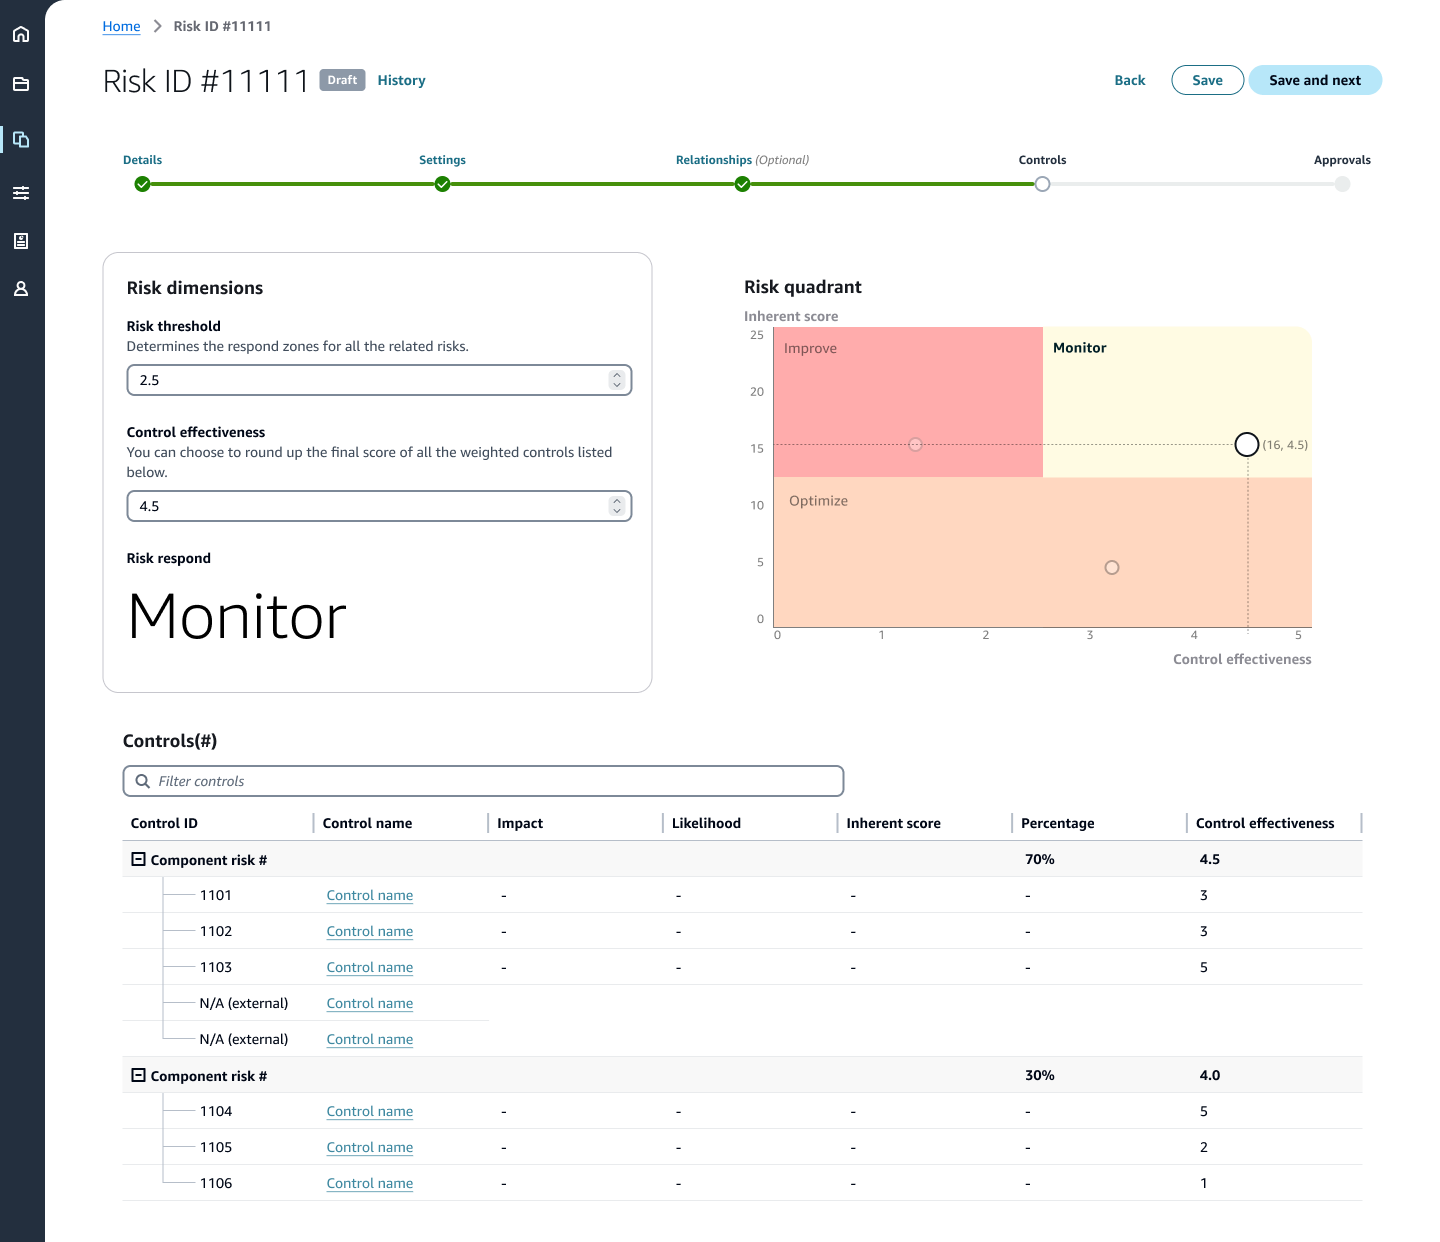
The first exists because "how severe is this risk" is not an answerable question. Asked cold, it returns a number reflecting the mood of whoever was asked.
So the questionnaire breaks it into 6 impact areas, offers each as a described consequence, and does the arithmetic in public. The abstraction becomes countable — and the count stays traceable to the sentences that caused it.
The second answers a different question: not how big the risk is, but what to do about it. Threshold and control effectiveness go in on the left, and a single verb comes out.
The quadrant beside it is evidence, not headline. 2 lines divide it — an appetite line fixed at 12.5 for everybody, and the inherited threshold. Above that line, weak controls mean improve and adequate ones mean monitor. Below it the whole band is 1 zone, optimise: once a risk is small enough, how tightly it is held stops being the interesting question.
Risk is organic and messy, and both screens carry more fields and more metrics than anyone would choose. The way through was to give each exactly 1 priority and let the rest recede: the score on the first, the decision on the second.
Both then obey the same spatial rule — what you put in stays left, what the system concludes stays right. The 2 screens belong to different steps and look nothing alike in detail, but nobody moving between them has to relearn where the answer lives.
Which raises the question the last 2 screens quietly depend on: who decided what those questions were? Each organisation's risk admin builds its own template — the impact categories, the wording of every option, the likelihood bands, which questions are mandatory, and the order they appear in.
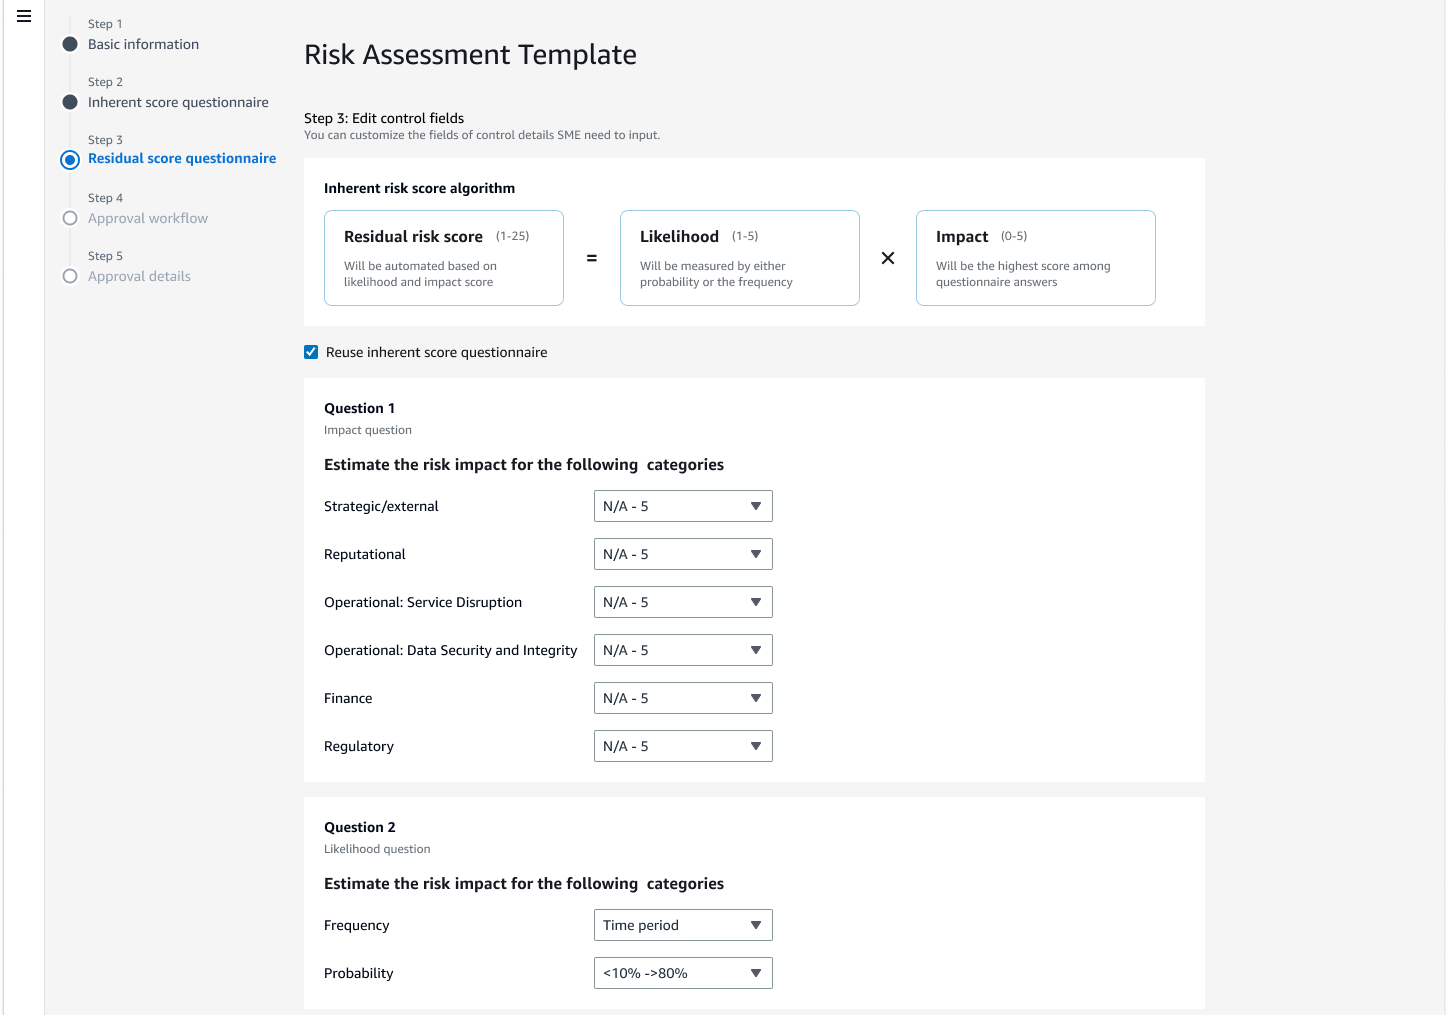
This is what makes a risk score reportable. Within an organisation, everyone answers the same questions against the same worded options, so 2 risks carrying the same number mean the same thing.
When that number reaches leadership or an external auditor it is a figure with a definition behind it — which is exactly what the old spreadsheets could not produce.
And because the template belongs to the organisation rather than the platform, 2 organisations can hold different standards without either becoming wrong. Consistency where it has to be enforced, latitude where it does not.
Components attach to and detach from an enterprise risk over time. Only a risk owner or practitioner can make that link, and every change has to be approved by whoever owns the enterprise risk — because it moves their number, not the requester's.
That queue is what makes the projected total shown earlier necessary rather than decorative. Without it, an owner would find out their posture had changed at exactly the moment they could no longer do anything about it.
4 things still unresolved. The first was cut deliberately, and the stated reason is the most interesting line in the whole brief.
The design was settled before the build, so there is no outcome data to report yet. What was fixed is scope and sequence: the scoring model, the parent-child mapping, export and the dashboard were targeted for April 2025, with re-assessment and versioning following later in the year.
The more useful gap is the missing baseline. None of the figures below were measured before the change, which is the first thing worth fixing.
[Add reflection — this section is yours to write. Worth considering: what you argued for when the methodology was being settled and what you lost, what you'd have wanted to test with a risk manager who did not want to change process, and whether the 3-zone quadrant survives being read by someone who cannot distinguish the 3 fills.]